This week, I continued my research on autocorrelation. I had an idea that autocorrelation might be stronger within individual paths, and that identifying and separating these paths could aid my train-test split. I spent a day exploring clustering methods, but didn’t achieve any substantial results. It was a fun experiment, though, and I decided not to pursue it further. Instead, I read more papers on autocorrelation and opted to use an established method for choosing block size, based on a variogram.
A variogram plots the semi-variance between points separated by a distance d, showing how the similarity between values changes with distance. The elbow point on the graph (in an ideal world) shows the distance beyond which increasing separation no longer leads to greater differences between values.
My varigram, however, looks like this:
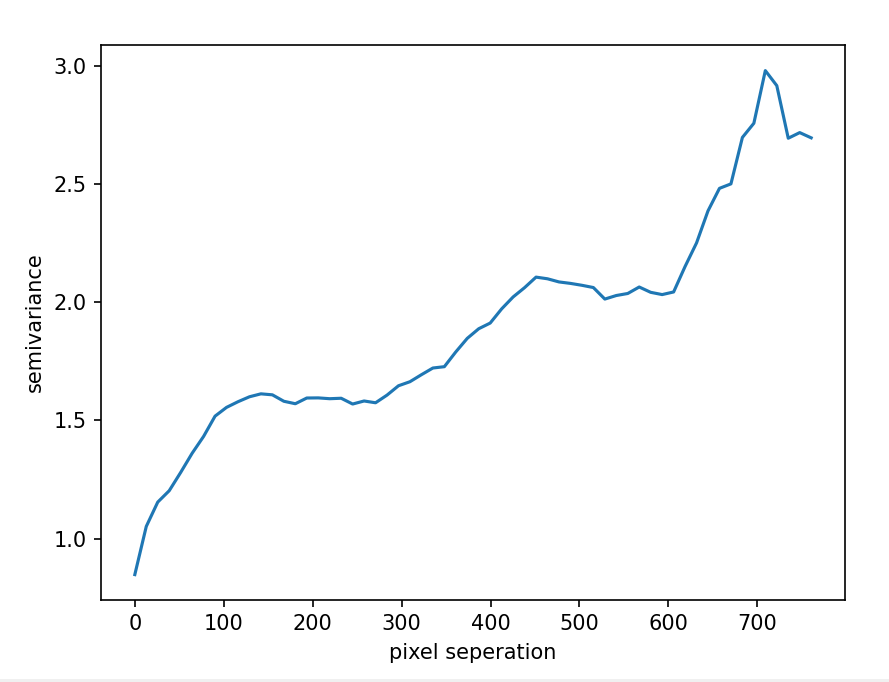
This first mini-elbow is the one I will have to choose (the second would result in blocks too big to successfully break up the landscape).
My block should be somewhere in the 80-150 range - around a km wide. This result is supported by my makeshift method of the previous week.
This week, I also added monthly weather data to the dataset, including temperature, precipitation, and humidity. To do this, I changed the structure of the raster maps so that each map represents a specific month and year, creating separate maps for each. All of these are fed into the model.
I did some hyperperameter tuning to produce a final model……
And the results weren’t very good 🙁