With a working model implemented with brownian bridge, the start of this week had a focus on formatting and code cleaning. Tasks that got completed:
1) Writing unit tests.
2) Writing code to pipeline the fetching of feature data from google earth engine. Before I was downloading the dataset manually for the areas, but this pipeline gets the relevant area to combine the data into a table with my calculated ranger data. In order to make this data compatible with my code I adjusted my code so it produced pixel grids measured in metres (not degrees).
Now that I have all the data, I started to think about how it is being formatted for training the model. I need to consider both the resolution of the map, and the train/test split. The best resolution that all of the features from google earth engine can be downloaded at is 90m. Something I wanted to investigate is how the percentage of data points that are labelled with a path/value changes with resolution (as shown in the figure below).
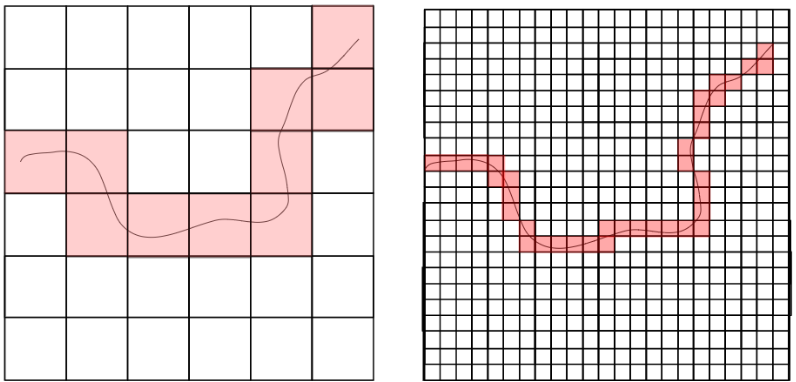
The highlighted area is the data that can be used for training/ testing our model. I don't believe it is something that should guide our decision too much, but I was interested to see how it would look.
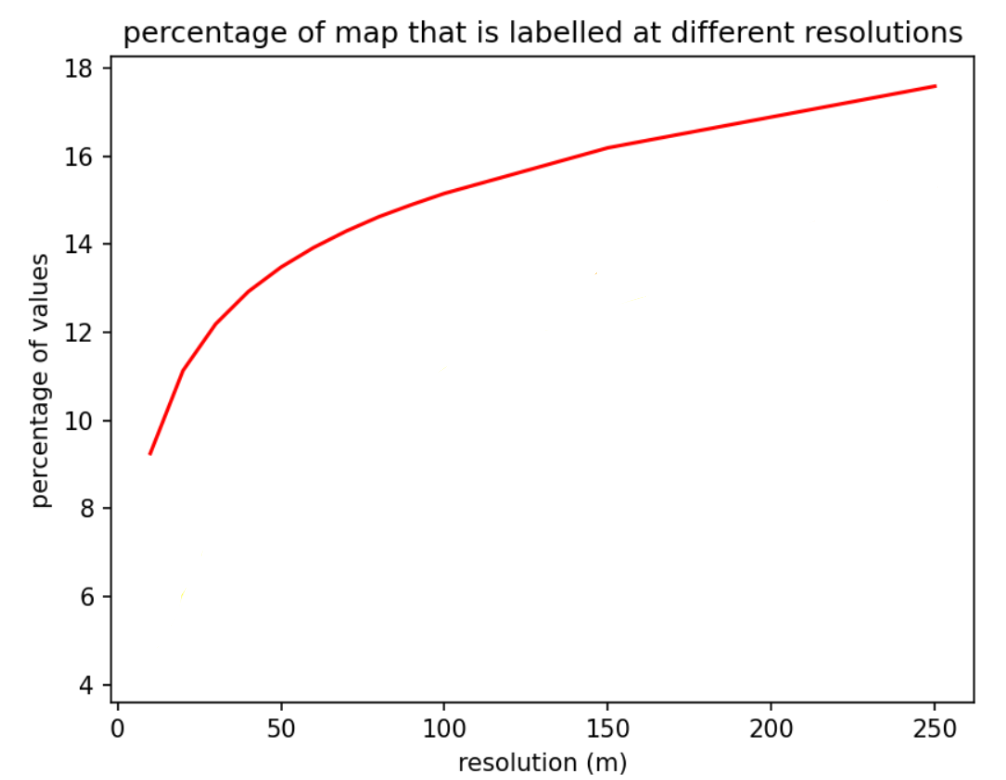
At my chosen resolution of 90m, about ~15 percent of my land area is labelled.
Now onto the main point I am deliberating over….
Train/Test split
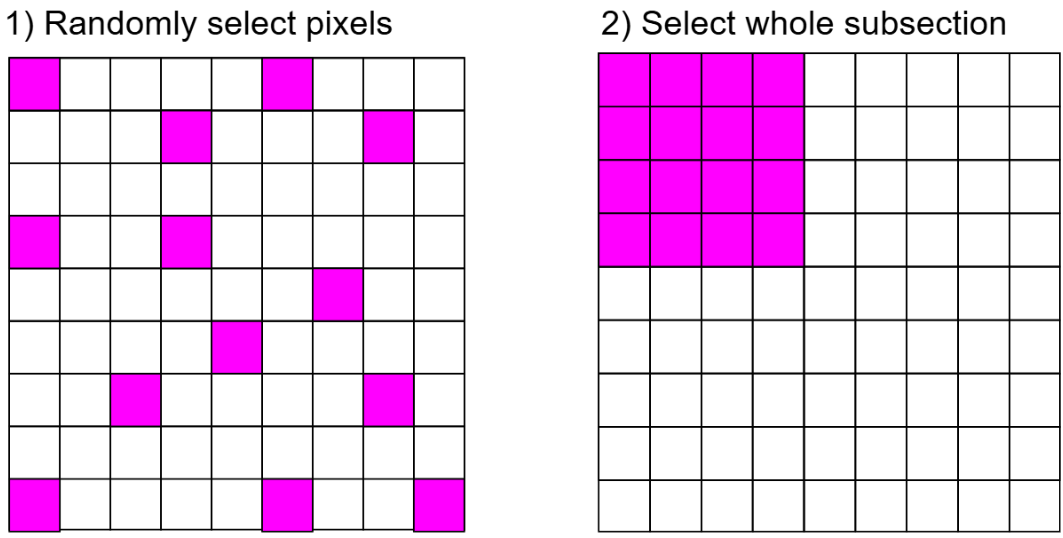
Method 1 suffers from autocorrelation. model will be overly-optimistic in it's success
Method 2 does not suffer from autocorrelation as much, but maybe not representative in it's training or testing
To balance both of these ideas, I looked into the idea of creating blocks (formed from many pixels) of train and test data. The figure below has blocks of 2 x 2, but they could be much larger.
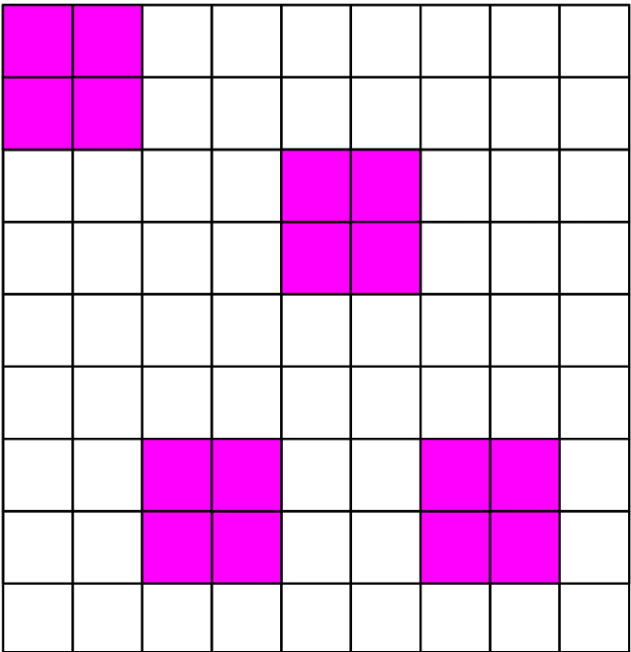
This helps reduce how much the training data is correlated with the test data—but by how much? I would assume that the larger the block size, the lower the correlation between train and test, but at some point this suffers from the same problem as ‘method 2’. I want to know the ideal block size, and if this is a valid method. I’m not really sure how to approach this currently, and have been struggling to find an answer in the literature, but i start by looking at morans I
Moran’s I calculates the spatial autocorrelation by measuring the covariance of values across space, weighted by how close locations are. You compare this to what you’d expect if the data were randomly distributed, and test for significance.
I ran Moran’s I on the rangers’ speed data. An important detail here is that many pixels have no recorded speed, since the rangers never traveled through them. Because Moran’s I cannot handle null values, I set these pixels to zero. To avoid bias from treating “no data” as actual speed, I tested significance by shuffling only the non-zero values. In other words, testing for spatial autocorrelation of speed only within the known data.
I want to know how the spatial autocorrelation is affected by block size. I tried investigating this by taking the average speed for each block (a square chunk of pixels) and found the autocorrelation between these averaged values. I did this for different block sizes, and marked which were significant.
The graph below shows Moran’s I calculated for blocks of different sizes. Each block is defined as 2^n pixels in both width and height, with each pixel representing 10 m × 10 m. This is different from the 90 m resolution mentioned earlier, but here I wanted to test autocorrelation across a whole range of scales. At the largest block size, 2048 × 2048 pixels, the area covered is roughly 20 km across.
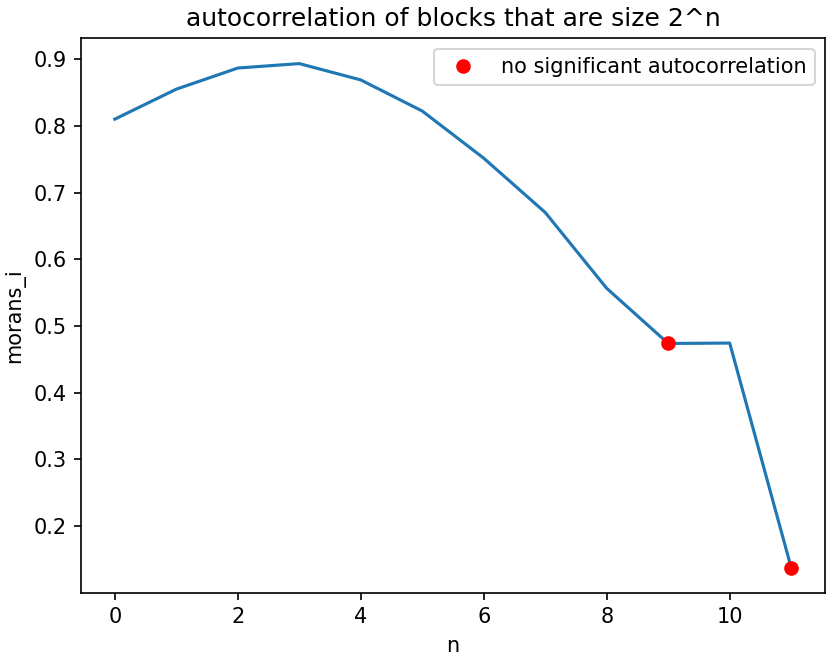
I’m not sure this is the correct way of doing things, and need to go into further research next week. It is intended to show the autocorrelation between blocks, but doesn't say anything about the autocorrelation within blocks. This within-block autocorrelation still poses an issue and will affect the model, but the between-block autocorrelation is what causes the correlation between train and test data. This is what would make the model look too optimistic. I believe that if I pick a block size that does not show significance in the between-block spatial autocorrelation, then I can at least trust the evaluation of my model.