For my project, I’m trying to understand the factors affecting the speed of movement of rangers traveling through selected national parks in Africa with the goal of improving patrol planning and the interception of poachers. Rangers have been equipped with GPS trackers that log their location and time approximately every five minutes during their patrols. I’m using this GPS data to identify existing footpaths and estimate movement speeds across different terrain types. The ultimate aim is to train a model that can predict ranger movement speeds based on environmental and geographical conditions, enabling more effective route planning. The first part of this project is focusing on identifying the existing footpaths.
The main focus of the first couple weeks has been on developing a method to estimate the likelihood that a footpath exists at any given location. I began by focusing on one of my selected parks, using GPS data collected by rangers during their patrols. While there are routes that rangers frequently travel, they sometimes deviate from these paths due to obstacles or to investigate findings such as poachers’ snares. I need to differentiate the noise from the commonly traveled paths, and identify such paths. My first idea was on some kind of clustering of these gps lines, to group together the data. I investigated this, as well as using brownian bridge simulations, but ultimately implemented kernel density ranking based on GPS point data
Kernel Density Estimation
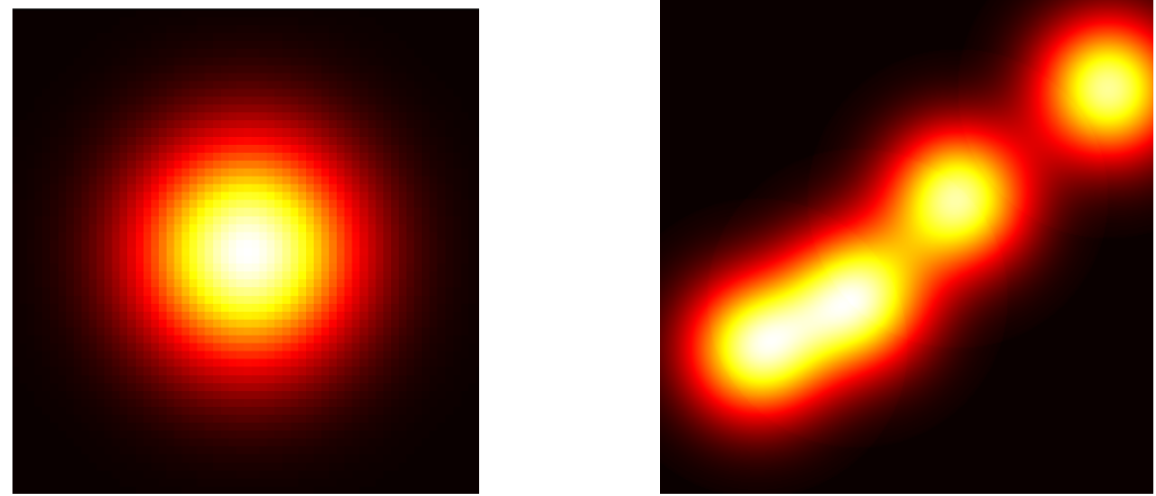
Figure 1: A 2D Gaussian distribution is centered at each data point, where the intensity is highest at the point itself and decreases with distance.
Figure 2: Where these Gaussians overlap, their intensities are summed, resulting in a heatmap storing the cumulative density of nearby points. This connects some points on the path.
Implementation Practicalities
The values for each pixel of the Gaussian are computed once and then “stamped” over each GPS point. They do not need to be recomputed every time.
I need to do further consideration into the standard deviation of the Gaussian. The current value is arbitrary, based on what looked visually reasonable with real data. I still need to do research to determine how it should relate to the real data.
Kernel Density Ranking
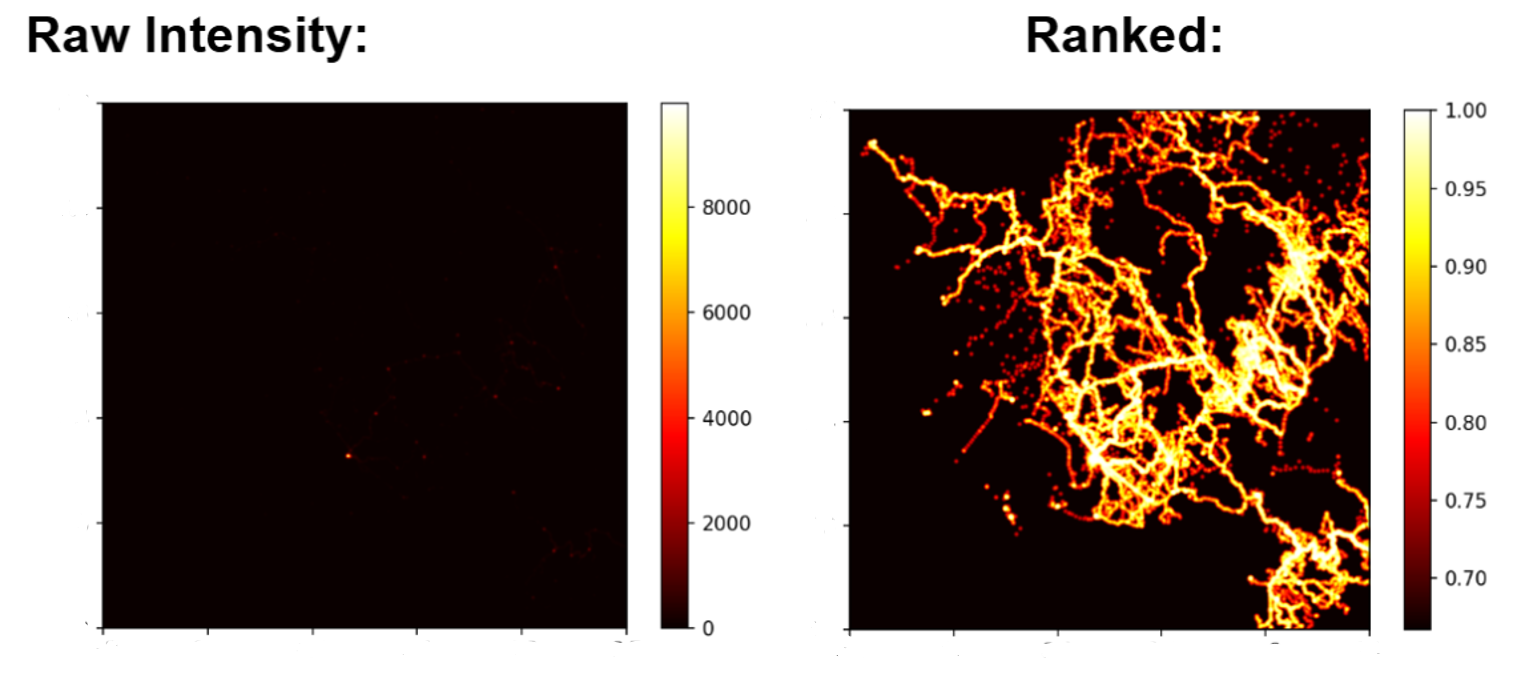
This produces the raw intensity values below. One issue with this is that it is skewed by the very large amount of time spent at base camp (the dot of base camp is the only thing visible). Kernel density ranking [link] is used to reduce the effect of the skew.