Adding Speed
Incorporating speed into our map was initially a bit of a challenge. The original GPS data we received lacked timestamps. It was stored as a Shapefile containing patrol paths, each with a start and end date and an ID. These paths were composed of a series of points—however, the points themselves didn’t include time information.
Instead, we had access to waypoints—logs maintained by rangers during patrols. Every few hours, the rangers would note environmental conditions or signs of poacher activity. These observations included an x, y coordinate and a timestamp. Our initial approach was to interpolate speed along each path segment based on the sparse waypoints. However, since there were typically around 15 GPS path points for every waypoint entry, this would have significantly reduced the accuracy of our speed estimates.
Fortunately, our contact at SMART later provided the data in GPX format. This version included a full sequence of [x, y, time] entries. Using this, we calculate the distance between consecutive points with the Haversine formula, then derive speed from the distance and time interval.
I assign each point the speed required to reach it from the previous one. I then compute a weighted average of speeds for each pixel in the map, using the intensity of the gaussian kernel as the weighting.

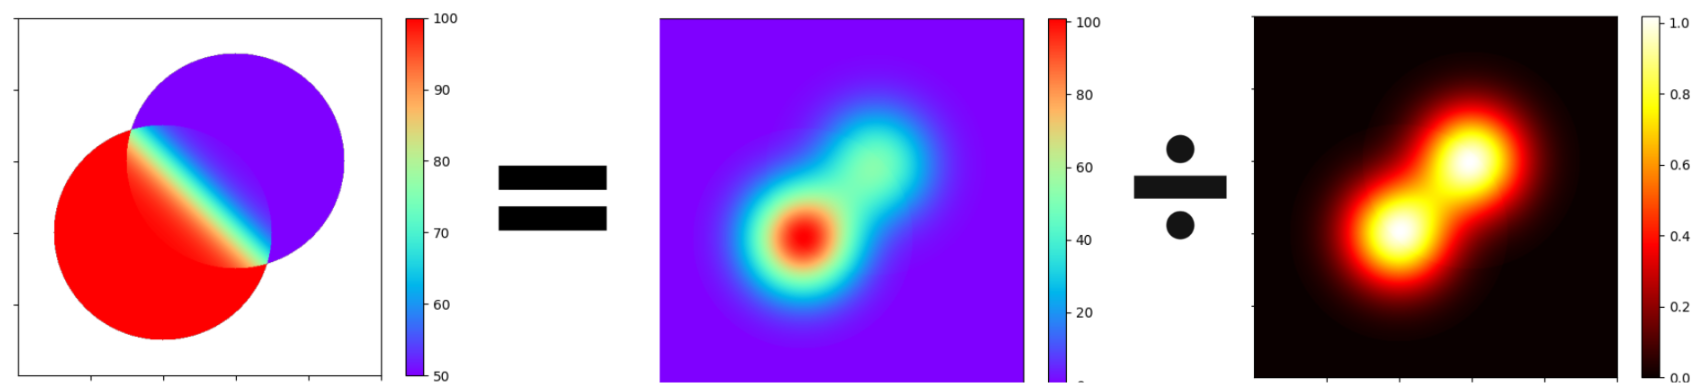
Applying this to the full dataset gave the following map:
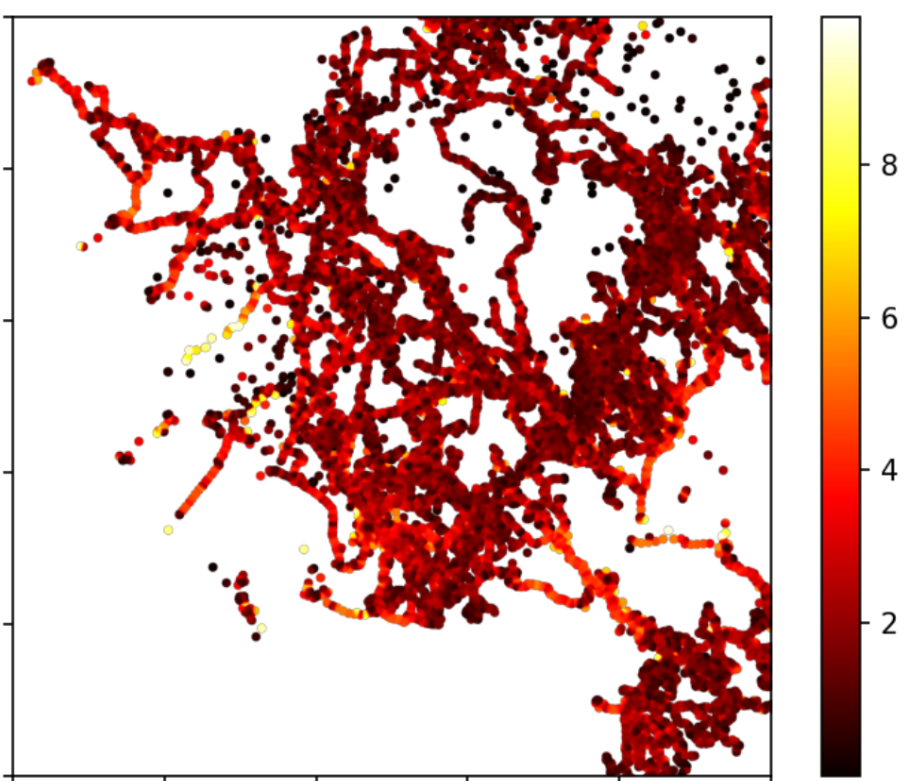
Speed vs Path
Just out of interest I wanted to see if we could see a relationship between speed and path intensity or rank?
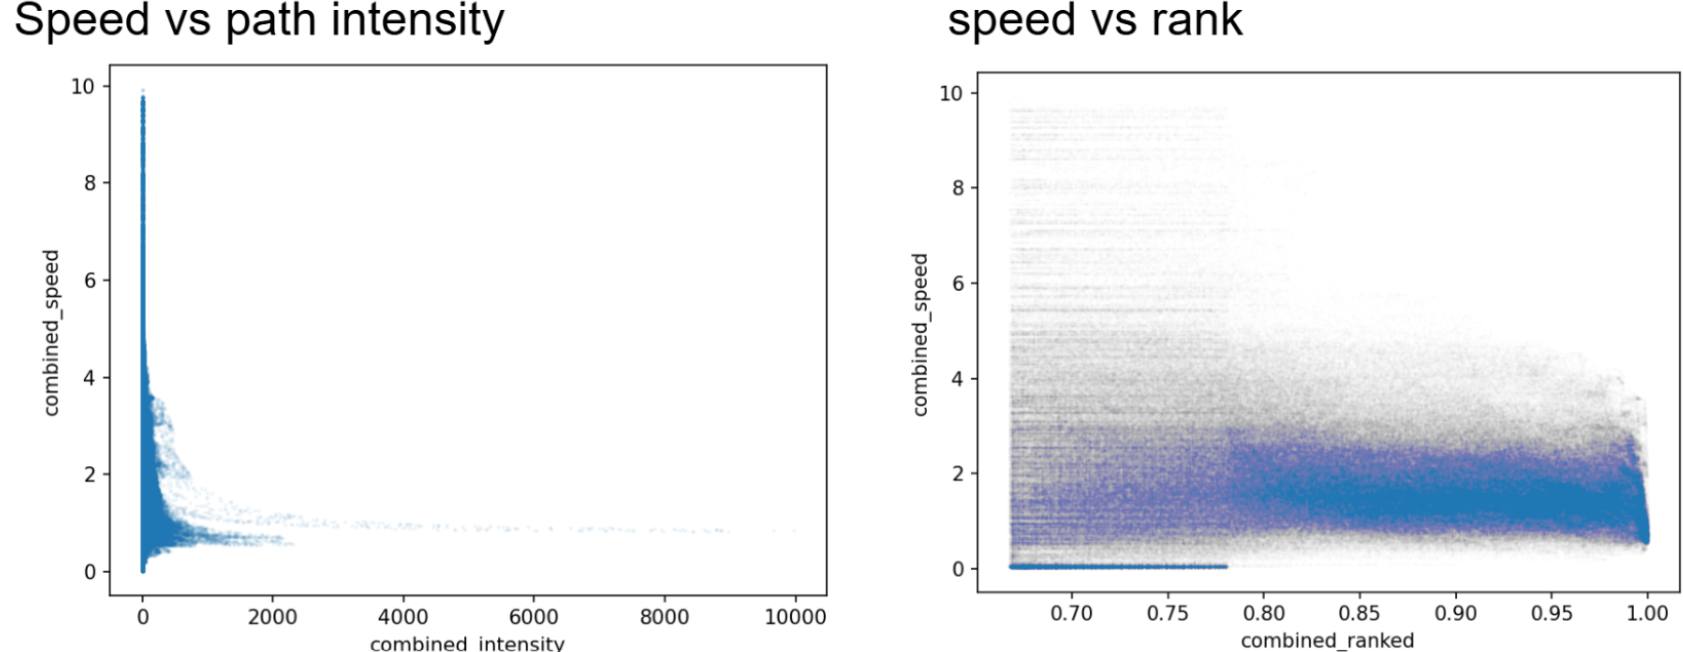
Nothing striking.
Calculating Directional Speed
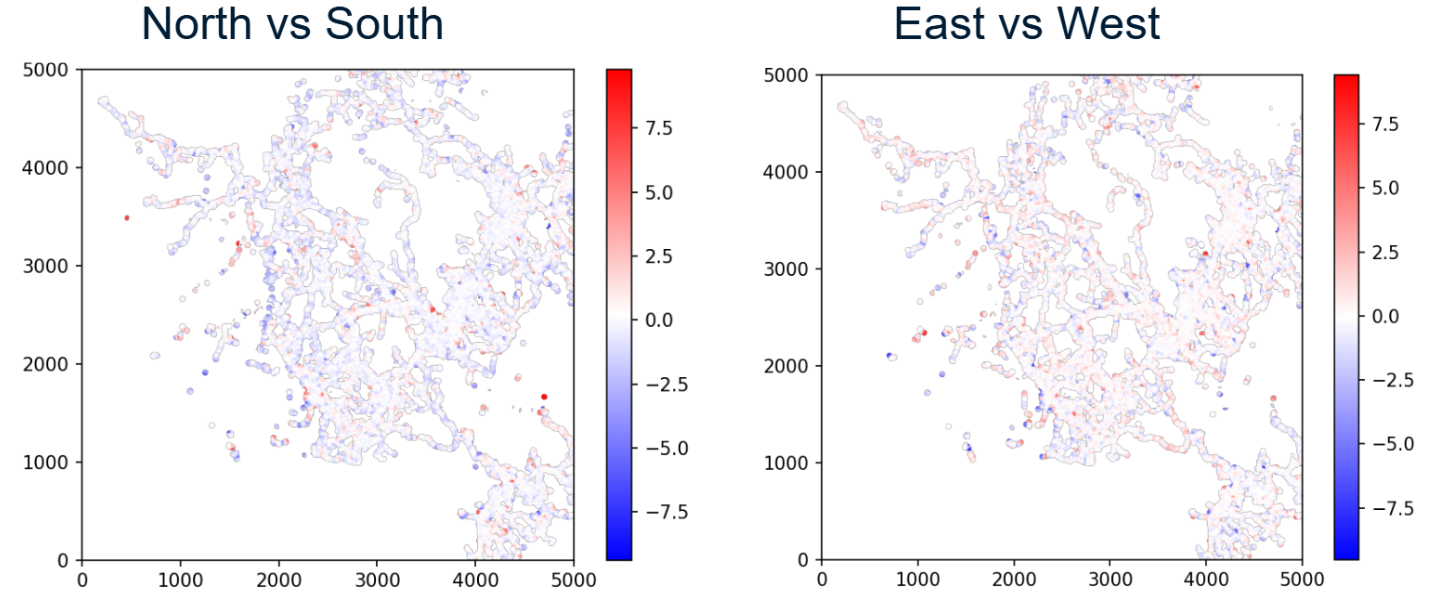
To investigate slope effects, we measure speed in four directions (N, S, E, W). This is done by computing vector components between GPS points. These are stored in four separate directional speed maps.
North vs South / East vs West
We checked if it’s significantly faster in certain directions due to terrain (e.g., steep hills). Maybe Subtly but no major differences observed.